Apex Debug Log Analyser
Apex logs are full of “stuff”. While that generally may be a good thing, getting around to the problem at hand may be a tad bothersome.
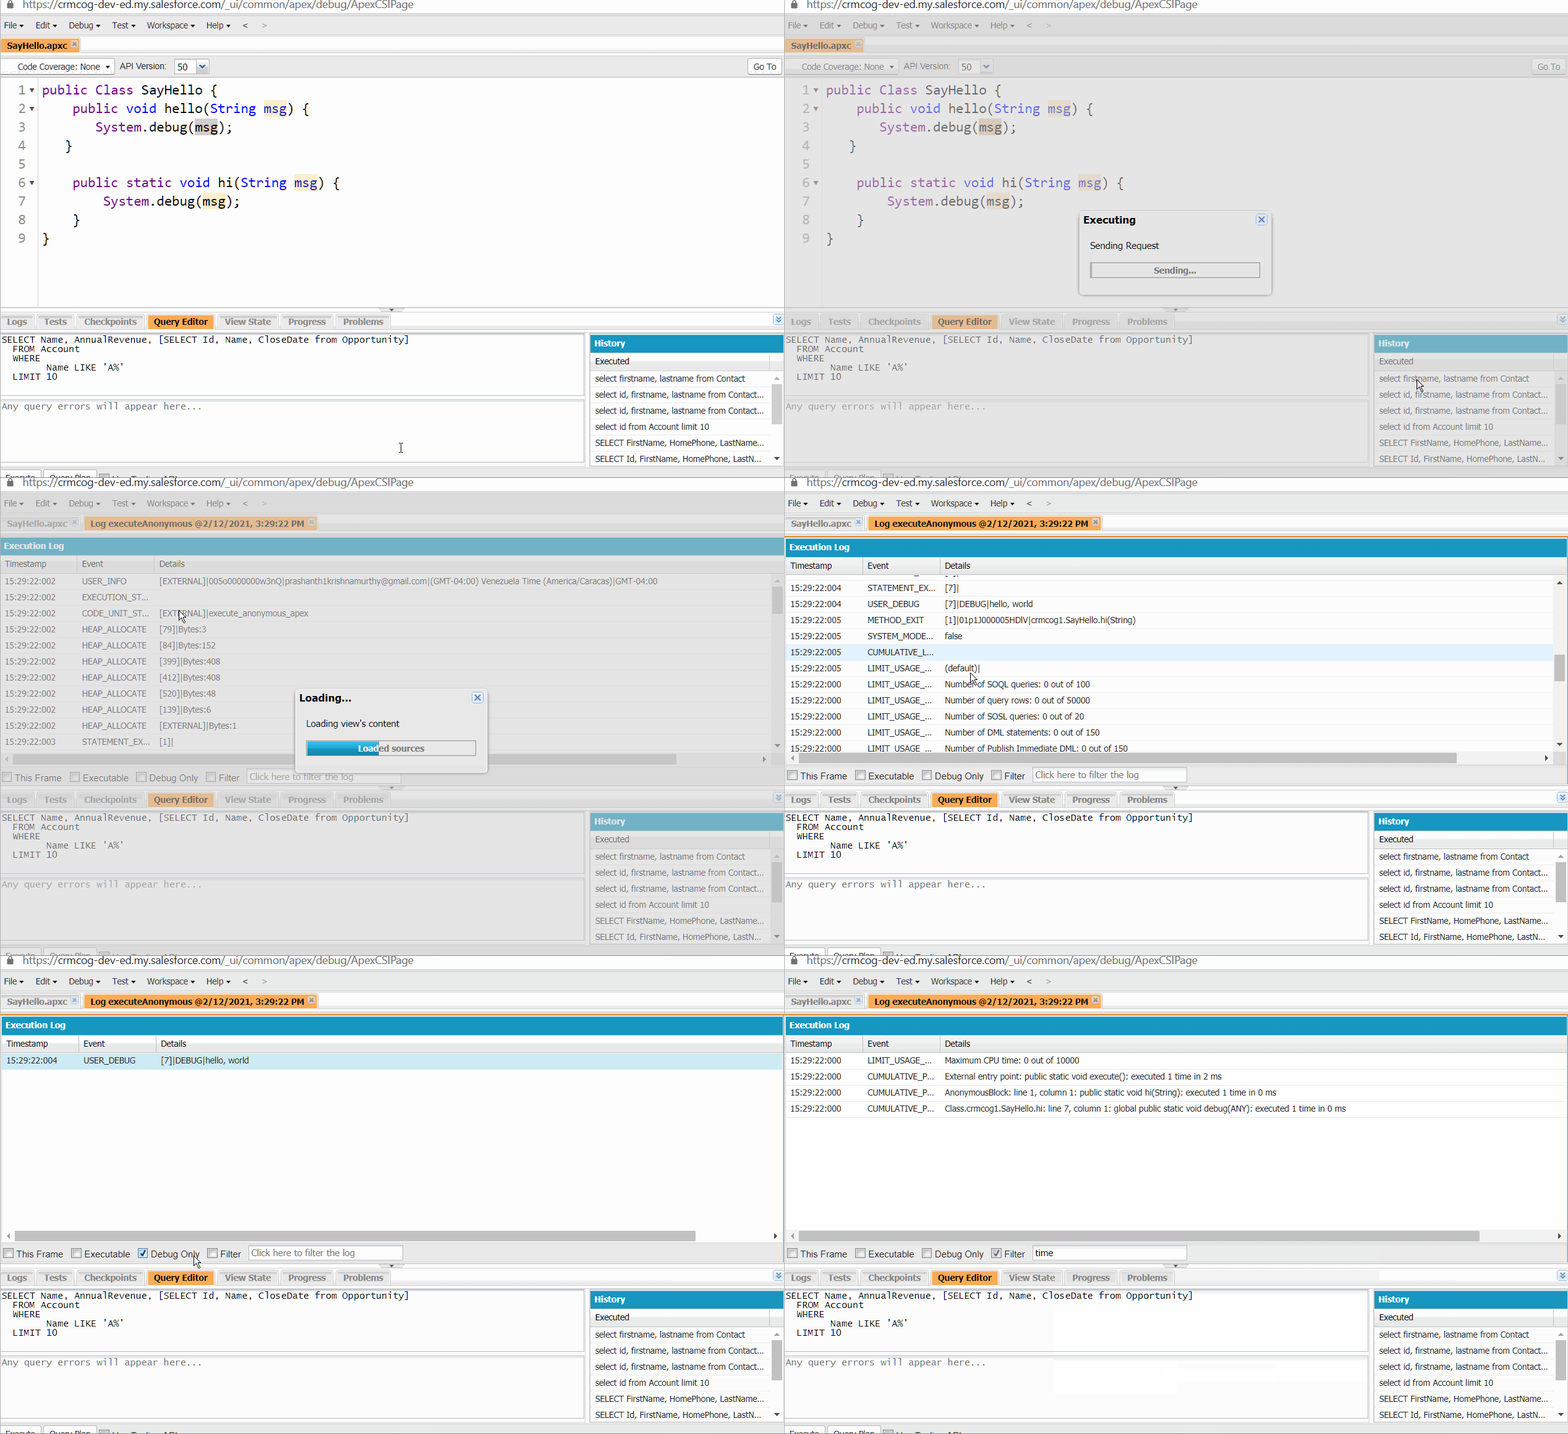
I don’t quite spending a lot of time debugging, but debug statements + log filters in Developer Console have been my go-to tools like any good developer.

I missed this in-place filtering / quick flags when I switch over to VS Code. While theoritically, you could just download debug logs easily and start working all your magic using vim/grep and all the other fantastic tools - practically, the couple of jumps it takes to get things to that state is just not worth it for “casual debugging”.
Well, things changed for the better.
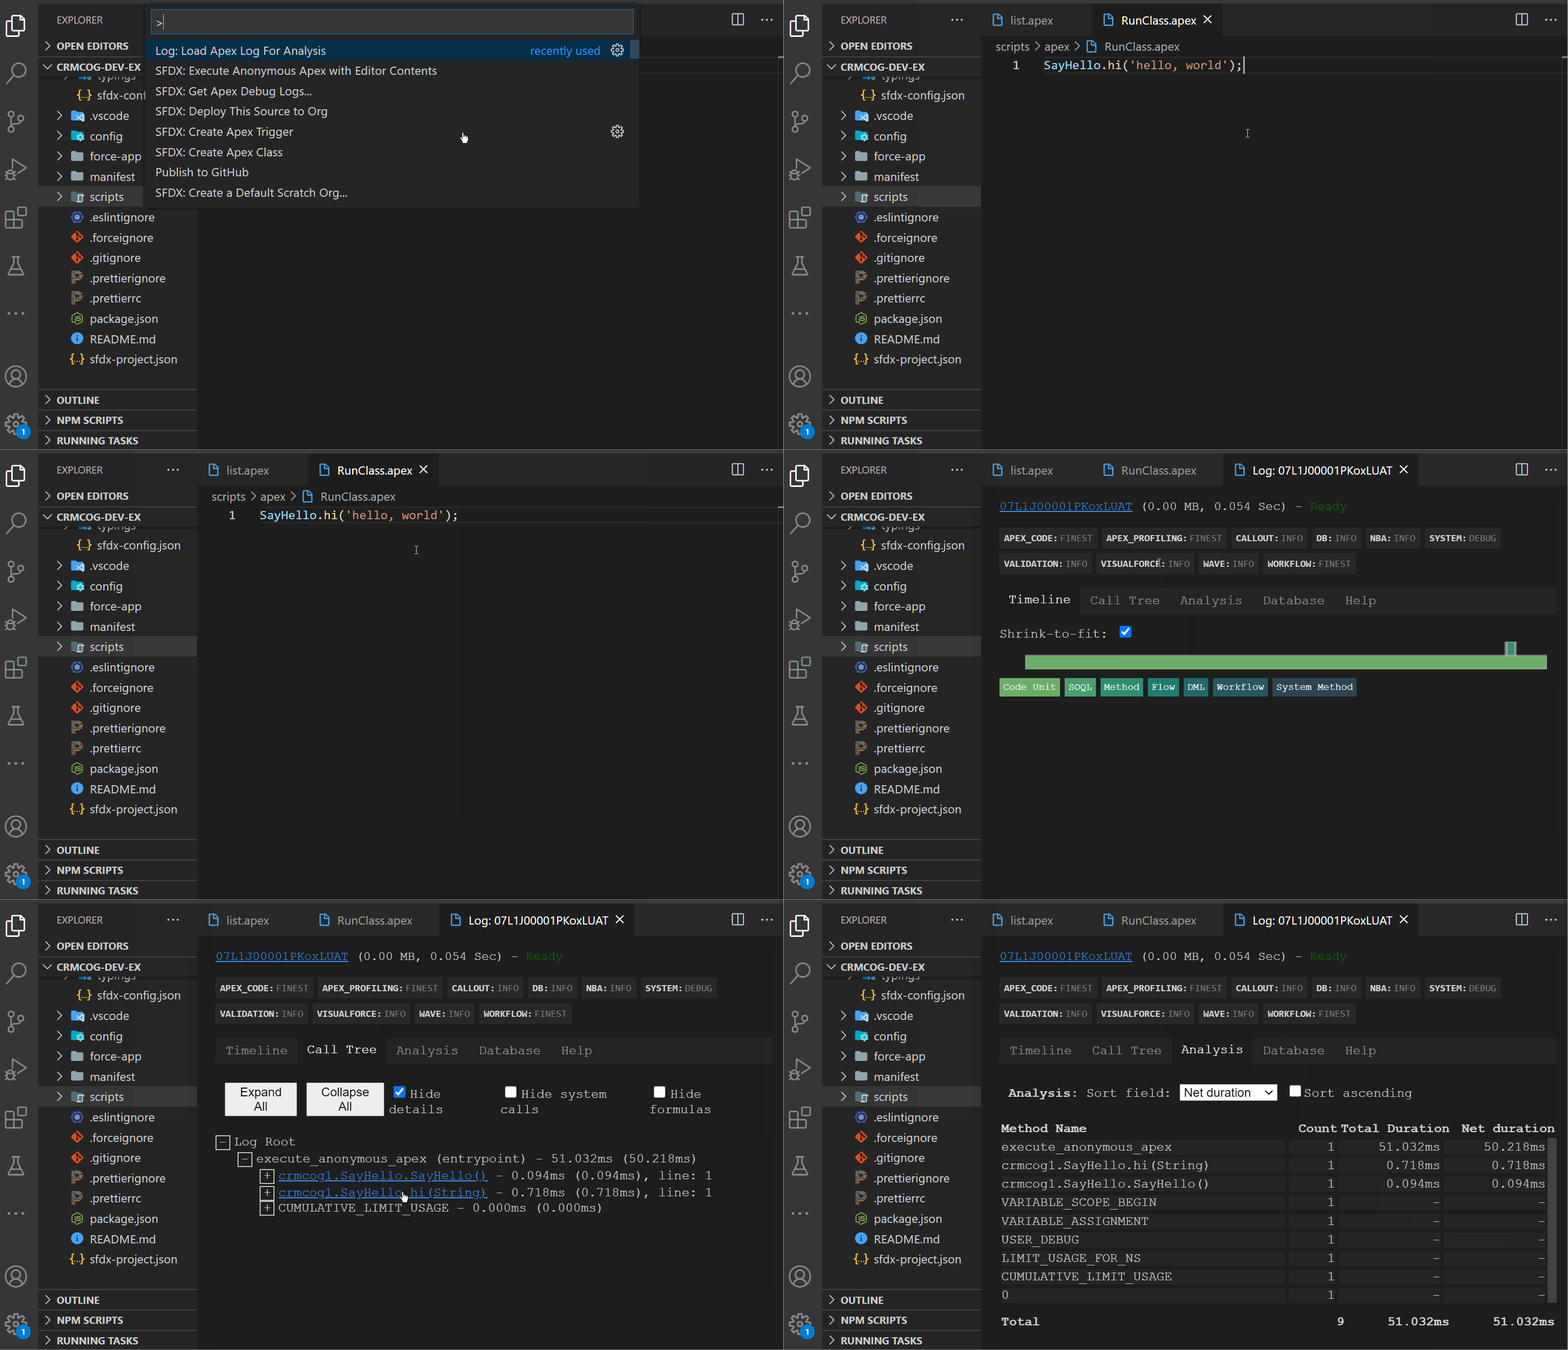
FinancialForce’s Salesforce Apex log analyzer is a good tool to get all the quick analyses from your Apex logs - right within VSCode.
All you have to do is -
- Install log analyser
- Run Apex code
- Select log to analyse

Makes life a bit easy, doesn’t it?
See the really long YouTube video if you feel like just watching others have all the fun.