The way of the Siebel logs
Logs are a standard way of debugging any software application, and Siebel is no exception.
For anyone who have spent more than six months in Siebel, you will know this - although configuration can be done without referring the logs, you become a smart developer only when you see what is going on behind the scenes.
Siebel logs exist into primary places - Developer/remote client and server.
Siebel logs on server #
Wvery component that exists in the Siebel server writes to their own log. Although you can theoretically disable the the entire logging process, I’ve not heard of anyone actually going ahead and doing that.
Enabling logs on the server is quite simple.
- Locate Siebel component in Administration – Server Configuration > Servers
- Change parameter values for all/selected events in the Events subview tab. Valid values that can be set here are 0-5. I typically set them to 4 if I have two debug anything, or set to 1 by default
You could also do the same thing using commandline statements.
change evtloglvl % = 4 for component WfProcBatchMgr
More details and examples in the debugging web client behaviour post .
As the level of logging increases, Siebel is going to write more and more details to the log file. The log file for the particular component can be found in
All the logs are collated together in in the same log folder. For example:
WfProcMgr*_xxxx.log
eMedical*.log
Each of these logs have file names reflecting the underlying components of the tasks, and Process ID suffixed to the name. This makes it easier to identify the log on the server.
A sample log is provided below -
ObjMgrSqlLog Detail 4 0 2012-08-25 11:30:23
***** SQL Statement Initial Fetch Time for SQL Cursor with ID 14E7E820: 0.000 seconds *****

ObjMgrSqlObjLog Execute 4 0 2012-08-25 11:30:23 Begin: Execute SqlObj 'JNJ Internal Division-Franchise' at 12997050
ObjMgrSqlLog Detail 4 0 2012-08-25 11:30:23 SELECT statement with ID: 151D2C30
SELECT
 T5.CONFLICT_ID,
 T5.LAST_UPD,
 T5.CREATED,
 T5.LAST_UPD_BY,
 T5.CREATED_BY,
 T5.MODIFICATION_NUM,
 T5.ROW_ID,
 T6.CMPT_FLG,
 T6.BASE_CURCY_CD,
 T6.LOC,
 T6.NAME,
 T4.NAME,
 T2.BU_FLG,
 T6.PAR_BU_ID,
 T6.PRTNR_FLG,
 T3.NAME,
 T6.PR_MGR_POSTN_ID,
 T6.PR_ADDR_ID,
 T6.ROW_ID,
 T6.MODIFICATION_NUM,
 T6.CREATED_BY,
 T6.LAST_UPD_BY,
 T6.CREATED,
 T6.LAST_UPD,
 T6.CONFLICT_ID,
 T6.PAR_ROW_ID,
 T2.ROW_ID,
 T2.MODIFICATION_NUM,
 T2.CREATED_BY,
 T2.LAST_UPD_BY,
 T2.CREATED,
 T2.LAST_UPD,
 T2.CONFLICT_ID,
 T2.PAR_ROW_ID,
 T1.ROW_ID,
 T1.MODIFICATION_NUM,
 T1.CREATED_BY,
 T1.LAST_UPD_BY,
 T1.CREATED,
 T1.LAST_UPD,
 T1.CONFLICT_ID,
 T1.CONTACT_ID,
 T1.BU_ID,
 T1.BU_ID,
 T1.CONTACT_ID
 FROM
 ADVSIT.S_CONTACT_BU T1,
 ADVSIT.S_BU T2,
 ADVSIT.S_POSTN T3,
 ADVSIT.S_ORG_EXT T4,
 ADVSIT.S_PARTY T5,
 ADVSIT.S_ORG_EXT T6
 WHERE
 T6.PAR_BU_ID = T4.PAR_ROW_ID (+) AND
 T6.PR_MGR_POSTN_ID = T3.PAR_ROW_ID (+) AND
 T5.ROW_ID = T6.PAR_ROW_ID AND
 T5.ROW_ID = T2.PAR_ROW_ID (+) AND T1.BU_ID = T5.ROW_ID AND
 (T6.INT_ORG_FLG = 'Y' AND (T2.BU_FLG != 'Y' OR T2.BU_FLG IS NULL)) AND
 (T1.CONTACT_ID = :1)
 ORDER BY
 T6.INT_ORG_FLG, T6.NAME
ObjMgrSqlLog Detail 4 0 2012-08-25 11:30:23 Bind variable 1: 0-1
ObjMgrSqlLog Detail 4 0 2012-08-25 11:30:23
***** SQL Statement Prepare Time for SQL Cursor with ID 151D2C30: 0.000 seconds *****

SQLParseAndExecute Bind Vars 4 0 2012-08-25 11:30:23 1: 0-1
ObjMgrSqlLog Detail 4 0 2012-08-25 11:30:23
***** SQL Statement Execute Time for SQL Cursor with ID 151D2C30: 0.003 seconds *****

ObjMgrSqlObjLog Execute 4 0 2012-08-25 11:30:23 End: execute SqlObject at 12997050
ObjMgrSqlLog Detail 4 0 2012-08-25 11:30:23
***** SQL Statement Initial Fetch Time for SQL Cursor with ID 151D2C30: 0.000 seconds *****

ObjMgrSqlLog Detail 4 0 2012-08-25 11:30:23
***** SQL Statement Initial Fetch Time for SQL Cursor with ID 151D2C30: 0.000 seconds *****

ObjMgrBusServiceLog Create 4 0 2012-08-25 11:30:23 Business Service 'Audit Trail Engine' was created at 15db9518
ObjMgrBusServiceLog InvokeMethod 4 0 2012-08-25 11:30:23 Begin: Business Service 'Audit Trail Engine' invoke method: 'Start' at 15db9518
ObjMgrBusServiceLog InvokeMethod 4 0 2012-08-25 11:30:23 Business Service 'Audit Trail Engine' invoke method 'Start' Execute Time: 0.000 seconds.
ObjMgrBusServiceLog InvokeMethod 4 0 2012-08-25 11:30:23 End: Business Service 'Audit Trail Engine' invoke method: 'Start' at 15db9518
ObjMgrBusServiceLog Create 4 0 2012-08-25 11:30:23 Business Service 'QAS_JSP' was created at 12d065e0
ObjMgrBusServiceLog InvokeMethod 4 0 2012-08-25 11:30:23 Begin: Business Service 'QAS_JSP' invoke method: 'GetQASListOfValues' at 12d065e0
ObjMgrBusCompLog Create 4 0 2012-08-25 11:30:23 Begin: construct BusComp "List Of Values" at 150c8e40
ObjMgrBusCompLog Create 4 0 2012-08-25 11:30:23 End: construct BusComp "List Of Values" at 150c8e40
You could view the laws created by individual components by viewing the details of the running task in Administration - Server management > Servers > Component > Tasks. However, I find it easier to debug from log files rather than the clunky application UI.
There may be specific tasks which may be assigned distinct subfolders within the parent log folder. For example: a separate subfolder is created for Siebel upgrade.
Integration specific logs can be enabled separately. Although the logs created by the underlying components for interfaces are in the same folder, there are specific parameters that you can enable to track input/output messages.
- Locate the interface OM in Enterprise > Server Configuration
- Set EnableServiceArgTracing parameter to TRUE
This will create *.dmp files in < Siebel server>\BIN directory.
Read more details on interface logging for web client .
Siebel logs on client #
Siebel client logs are enabled in the developer/remote computer. All client transactions can be logged only on the specific computer, and these details are not passed across to the server. The only information that server gets east through Synchronisation Manager component at the time of server/client synchronisation.
Client log levels are set as environment parameters in the developers/users computer.
Navigate to System option in Control Panel. Click “Environment Variables” button in the Advanced tab. Set the log parameters in “System Variables” section.
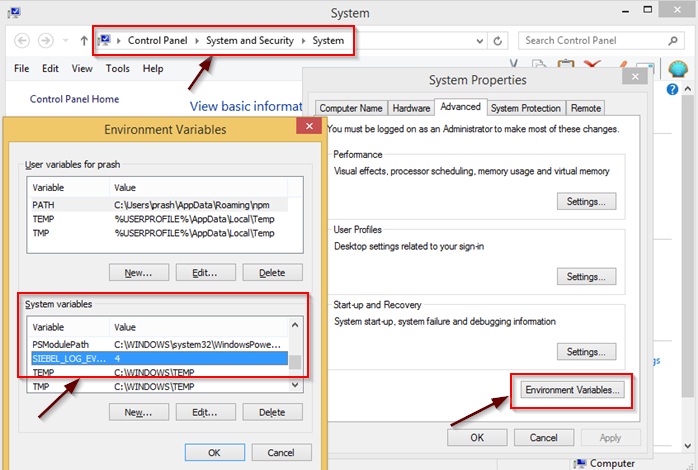
The following two environment variables are important -
SIEBEL_LOG_ DIR: By default set to the < Siebel client>\log folder, but can be changed by the user ( though I don’t know why the heck anybody’s going to do that)
SIEBEL* LOG* EVENTS: By default this is set to 1. But you need to set it to 4 for any decent debugging.
The logs are created on the remote client for both clients functioning in off-line mode and for dedicated client.
In addition to these logs, you can have two more prominent ways of debugging client behaviour -
- Spool the output from client.
All the SQL generated by Siebel will be output to the Spool file.
You provided Spool file as one of the commandline arguments at the time of starting Siebel. - Create interface specific logs.
In [EAISubsys] section in the CFG, addEnableServiceArgTracing = TRUE. This will log the input/output XMLs in*.dmpfiles. The parameter has to be used in combination with Siebel log events described above.
Both server and client Siebel logs provide the following important information:
- UI events including login, user actions like button clicks, and results from user actions for read, update, create and delete
- Memory allocation/deallocation to create UI and business layer objects
- SQL generated by the OM, and query performance
- Warnings and errors generated by the application
.. and much more.
In summary: Although you could enable more than one type of log in Siebel, the main logs continue to be created in server/client, and provide invaluable information to debug any application issues.