Check Page Performance in Salesforce
Here are two quick ways to manually (& reliably) track of Salesforce page performance.
Suffix eptVisible Flag #
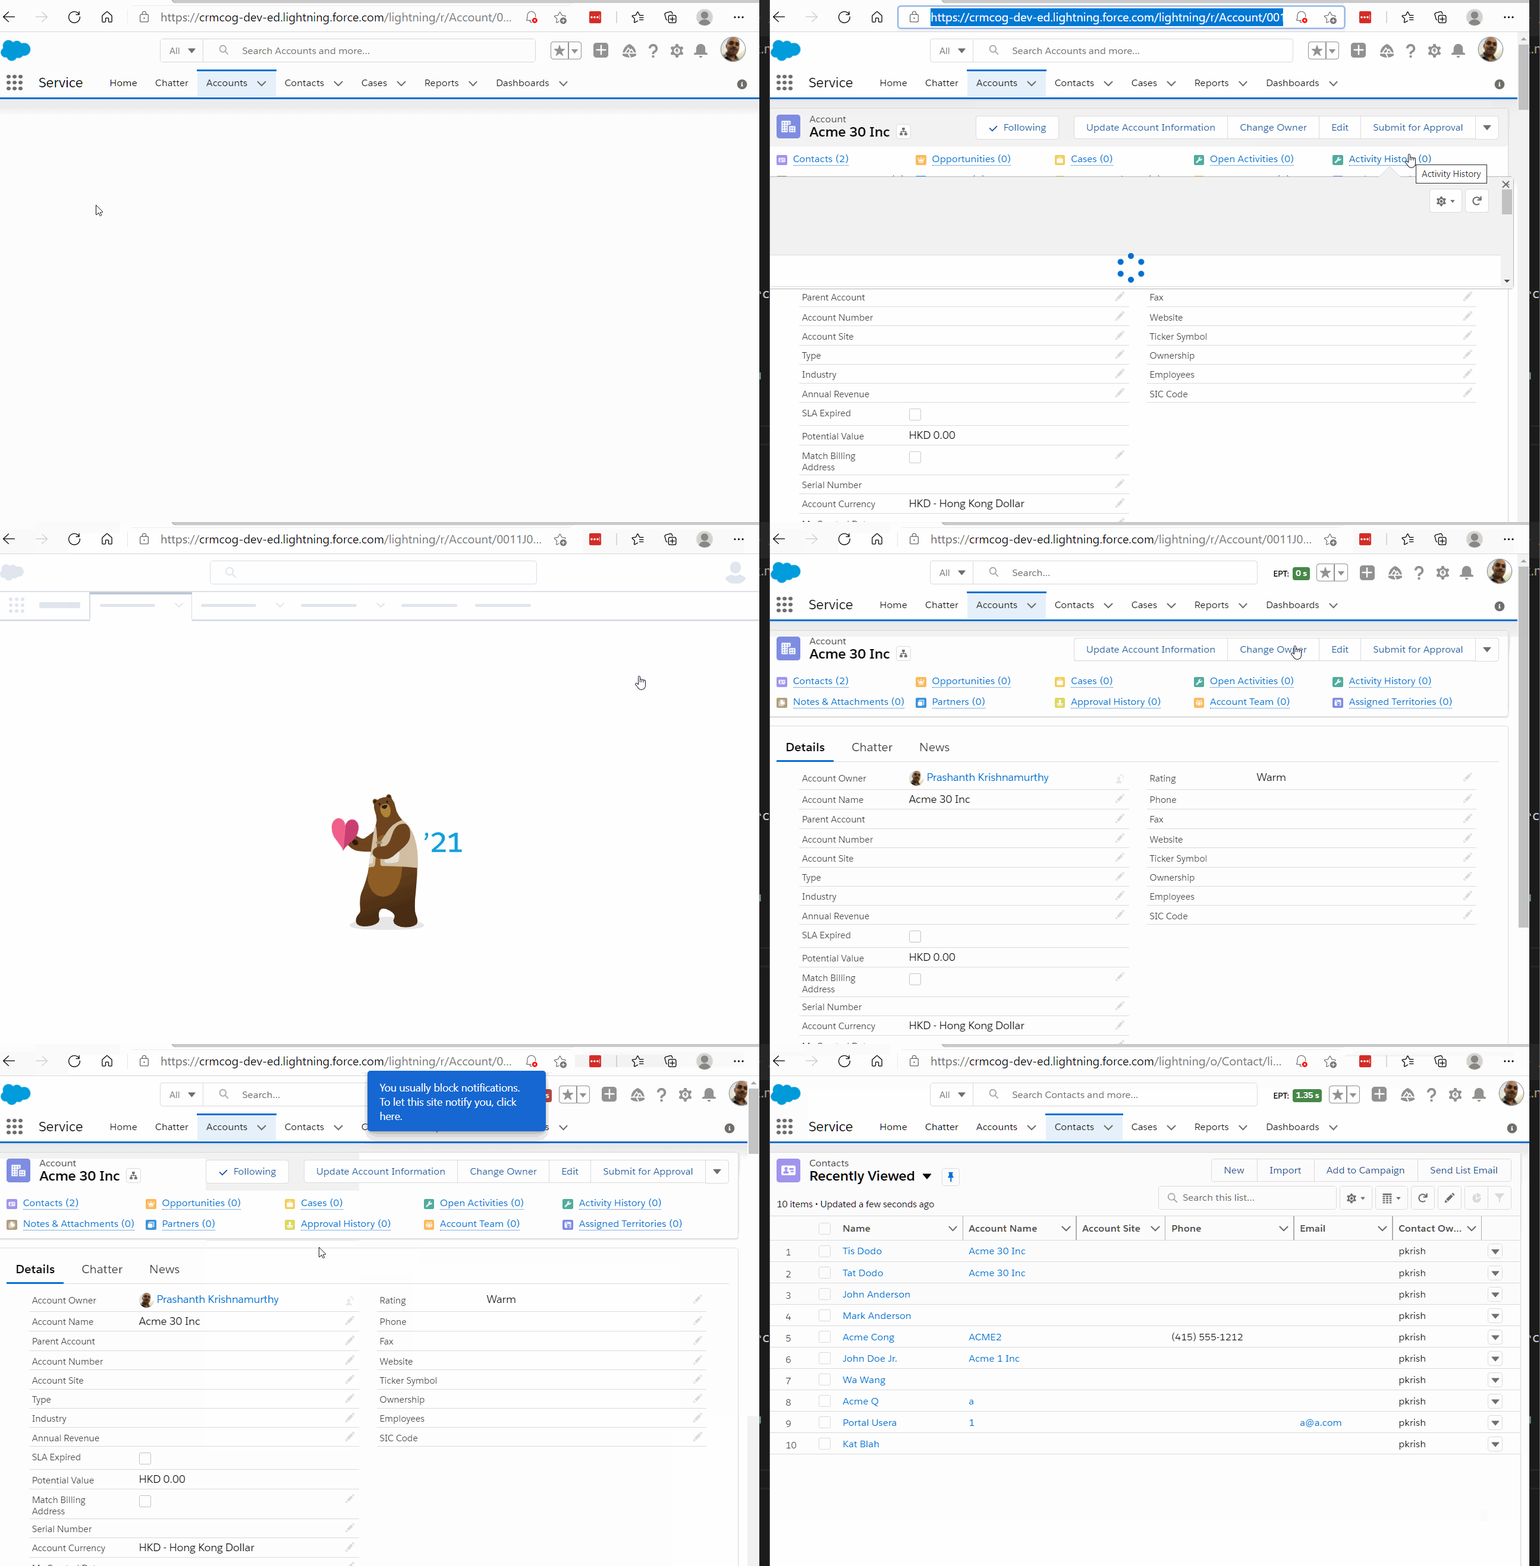
Navigate to any Salesforce application URL like you always do, but with a suffix - ?eptVisible=1. You will see the overall page performance at the top.

The flag will remain active for rest of your sessions once enabled.
Enable debug mode #
Go to Setup > Custom Code > Lightning Components > Debug Mode. Select a specific user and hit Enable to turn on debug mode. This method has the added advantage of having a lot more debugging tools enabled for user. UI performance measurement is one of them and is quite useful too.
Alternative: Use Browser Developer Tools #
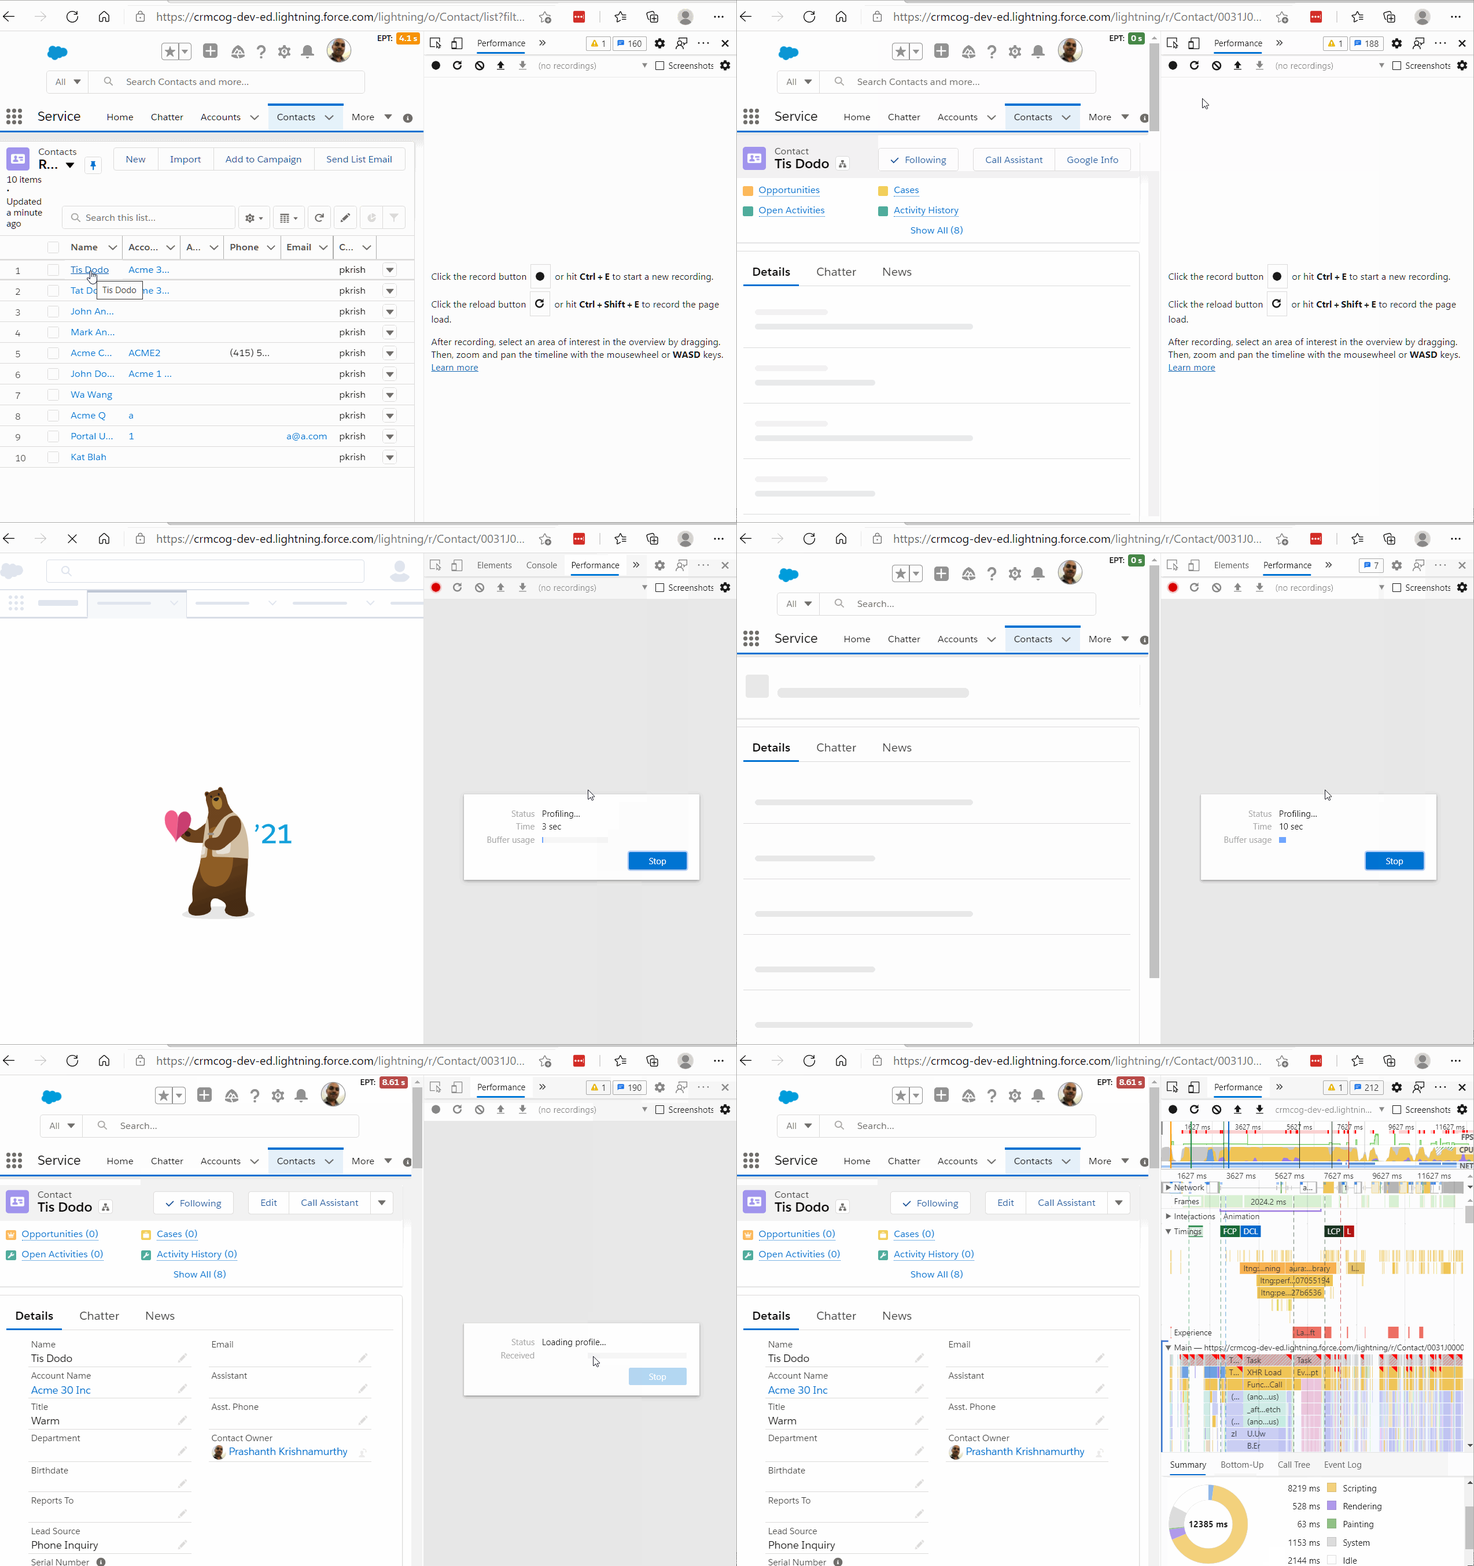
Performance checks in the browser developer tools is also an option to check performance - but it requires a couple of more steps, has lot of noise, and is not super friendly for our use case :)

How not to check performance? #
Considerations -
- Do 5-10 iterations and take an average
- Account for variances due to regions / different Internet speeds
- Do not reload entire page from browser
- Do not clear cache every time to record performance. That is not a reflection of how things happen in real world
While the manual performance checks are useful for quick identification of issues, they cannot be taken as the single, final statement of your application performance. Plan for performance/load testing if performance is a critical for your application.